
how this gif was made
generation prompt
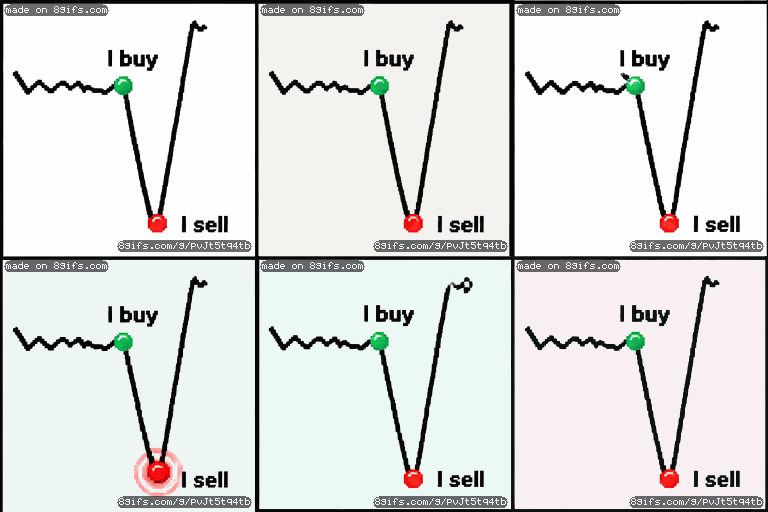
A jagged black line on a plain white background, resembling a financial stock chart. The line starts with minor fluctuations, then hits a peak marked by a solid green dot with the text 'I buy' above it. The line then plunges vertically into a deep valley. At the bottom of the valley is a solid red dot with the text 'I sell' to its right. Immediately after, the line shoots upward at a steep angle to a new high. The animation shows the line progressing across the screen, the green 'I buy' dot appearing at the peak, the sharp crash, the red 'I sell' dot appearing at the bottom, and the subsequent moon-shot recovery.
Characters: A financial stock chart meme illustrating poor trading timing.
what the ai read
A jagged stock market chart shows a green dot labeled I buy at a peak and a red dot labeled I sell at the bottom of a dip in this pixel art meme GIF.
motion steer
the chart line pulses with electrical jitter while the buy and sell indicators flash rhythmically
more gifs
