
how this gif was made
generation prompt
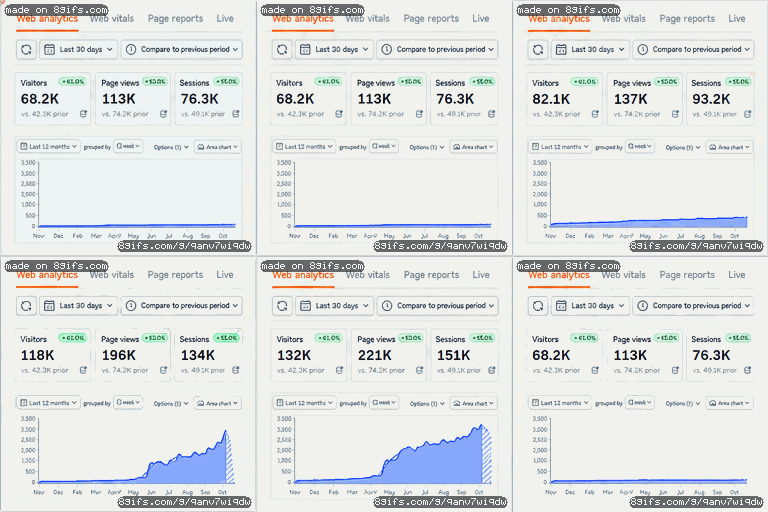
A pixel-art recreation of a web analytics dashboard interface. The top menu features 'Web analytics' in orange text. Three white metric cards show 'Visitors 68.2K', 'Page views 113K', and 'Sessions 76.3K' with green '+61.0%', '+53.0%', and '+55.0%' badges. Below the cards, a large area chart displays a blue line that starts flat and then spikes sharply upward, filling with a blue gradient and white diagonal stripes at the end. The blue line of the chart draws itself from left to right across the frames, and the metric numbers tick upward. A small red exclamation mark icon next to 'Installation Health' blinks.
Characters: A web analytics dashboard showing rapid growth metrics and a spiking chart.
what the ai read
A pixel art web analytics dashboard shows visitor numbers and page views rapidly increasing as a blue line graph spikes upward in a continuous loop.
motion steer
The area chart draws a sharp upward spike while numerical values increment and a health icon pulses.
more gifs
